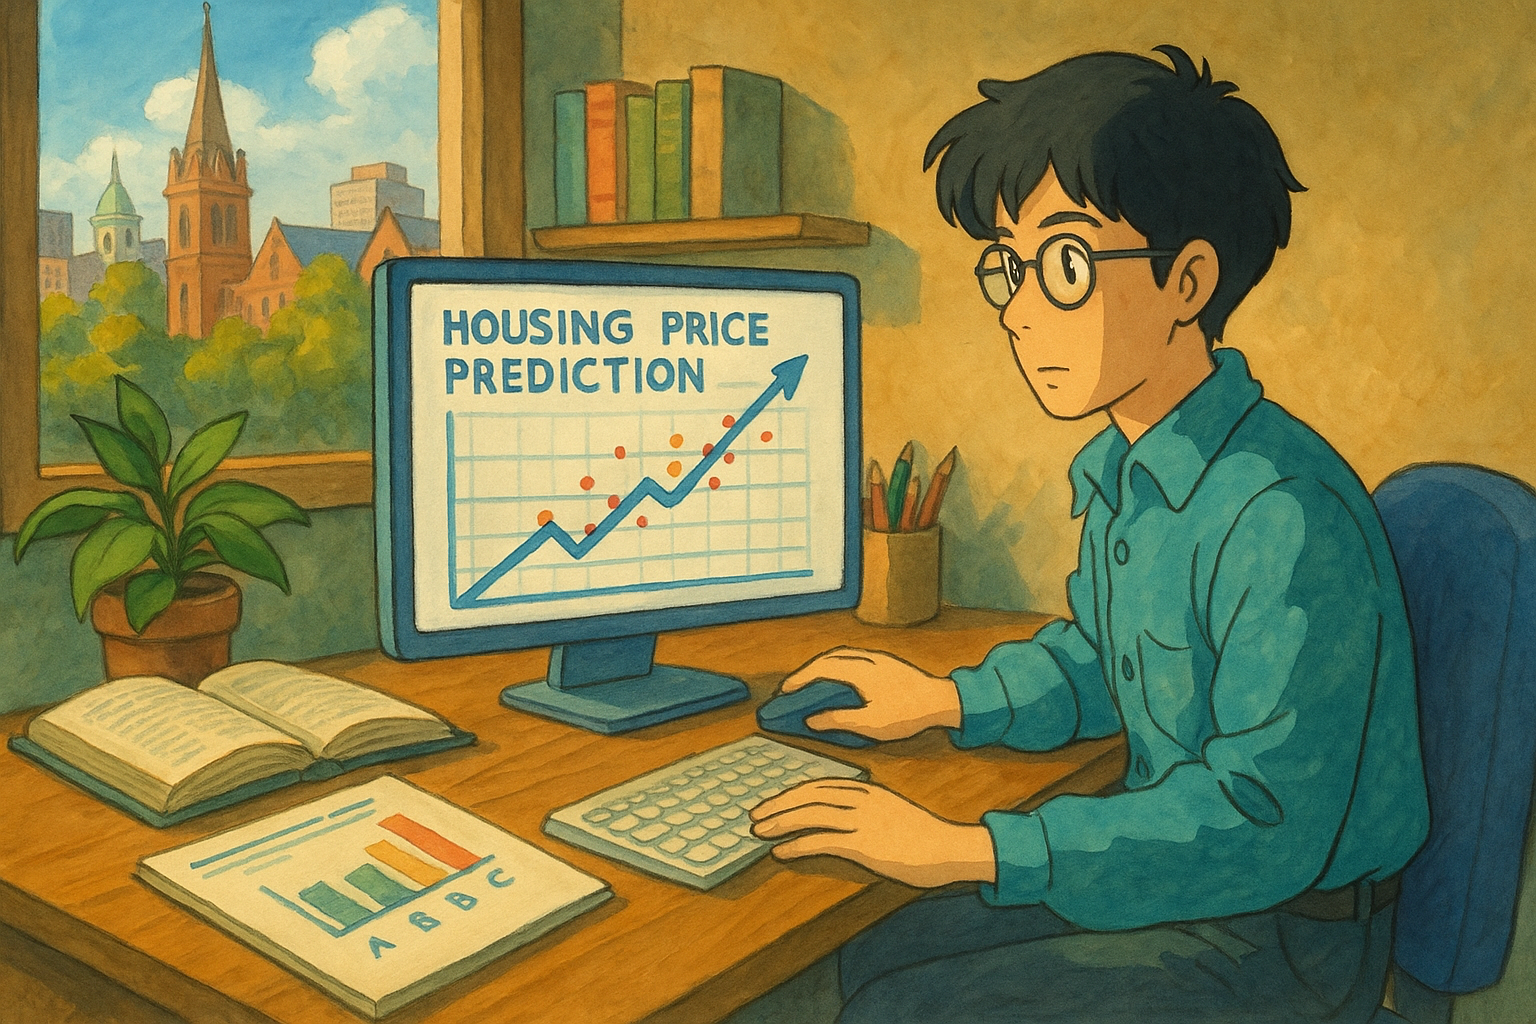
Boston House Price Prediction – Linear Regression in Action
In this blog, I’d like to talk about the aim and the step-by-step logic behind building a simple model to predict house prices using multiple features.
We will use the Boston Housing dataset to train a linear regression model that can predict house prices based on factors like the number of rooms, distance to employment centers, property tax, and more.
This is a continuation of our last blog, where we explored and preprocessed the dataset.
Now we’ll move into:
- Building the actual predictive model
- Interpreting its output
- Using it to make price estimates in real-world terms
We’ll walk through:
- How we train the model
- How we measure how well it learned
- How we make predictions using it
- Why we apply a log transformation to prices
- How we scale those estimates to reflect today’s market
Let’s begin!
Preparing the Data
Check out the previous blog post to learn how to load the dataset, including the data URL and preprocessing steps up to this point.
In this step, we’re finishing the data setup so that it’s ready for modeling.
1
2
3
4
5
6
7
data = pd.DataFrame(data=data, columns=features)
data["Price"] = target
data = data.drop(["INDUS","AGE"] , axis =1)
log_prices = np.log(data.Price)
target = pd.DataFrame(data=log_prices, columns=["Price"])
features = data.drop(["Price"],axis=1)
property_stats  = np.ndarray(shape=(1,11))
Creating a “Typical House” to Predict On
Before we can ask our model, “How much would a house like this cost?”, we need to describe what “this” house looks like. That’s where this piece of code comes in:
1
2
3
4
5
RM_IDX = 4
CHAS_IDX = 2
property_stats = features.mean().values.reshape(1,11)
property_stats
1
2
3
array([[3.61352356e+00, 1.13636364e+01, 6.91699605e-02, 5.54695059e-01,
        6.28463439e+00, 3.79504269e+00, 9.54940711e+00, 4.08237154e+02,
        1.84555336e+01, 3.56674032e+02, 1.26530632e+01]])
Fitting Model using SKlearn
1
2
3
regr = LR()
regr.fit(features,target)
fitted_vals = regr.predict(features)
Measuring How Well the Model Learned
After training our model, we want to know:
“How good is it at predicting house prices?”
To answer that, we use two common evaluation metrics: MSE and RMSE.
1
2
3
4
MSE = mse(target,fitted_vals)
RMSE = np.sqrt(MSE)
print("RMSE: ", RMSE)
print("MSE: " , MSE)
1
2
RMSE:  0.18751213519713034
MSE:  0.03516080084618688
get_log_estimate() – A Function to Estimate Boston House Prices
This function is the core of our price prediction tool. It takes a few simple inputs about a house — like how many rooms it has and whether it’s next to the Charles River — and returns a log-based estimate of the house’s price, along with an upper and lower bound for that estimate.
Let’s walk through every part of the function and understand the full thought process behind it.
Purpose of the Function
The goal of get_log_estimate() is to simulate a realistic Boston house by:
- Starting from the average values of all features (our
property_statstemplate), - Changing only the features the user specifies (like number of rooms),
- Then using the trained regression model to predict the price of that specific house,
- And finally returning a price range with either 68% or 95% confidence.
But — since our model predicts log-transformed prices, we use this function only to get log-estimates. The actual dollar conversion and inflation scaling will be handled by another function later.
1
2
3
4
5
6
7
8
9
10
11
12
13
14
15
16
17
18
19
20
21
22
23
24
25
26
27
28
29
30
31
32
33
34
35
36
37
38
39
40
41
42
43
44
45
46
47
48
49
### Select current Median price of houses in Boston in  -> villow_median_price
villow_median_price = 583.3
training_median = 21.199

## our scaling factor
sc = villow_median_price/training_median

def get_log_estimate(rooms_num , next_2_river = False,high_confidence = True):

    """
    Estimate the price of a property in Boston

    Keywords Arguments:
    rooms_num -- Number of Rooms
    next_2_river -- True is property is next to river , False otherwise
    high_confidence -- True for a 95% Prediction Interval, False for a 68% Interval


    """

    if rooms_num <1 or rooms_num > 8:
        print("Please enter a more realistic number ")

        return None
    ## Room indexing
    property_stats[0][RM_IDX] = rooms_num

    ## River indexing
    if next_2_river:
        property_stats[0][CHAS_IDX] = 1
    else:
        property_stats[0][CHAS_IDX] = 0

    ## converting to df
    property_stats_df = pd.DataFrame(data = property_stats , columns=features.columns)
    ##  Prediction
    log_estimate = regr.predict(property_stats_df).item()

    ## Confidence calc
    if high_confidence:
        upper_bound = log_estimate + 2* RMSE
        lower_bound = log_estimate - 2* RMSE
        interval = 95
    else :
        upper_bound = log_estimate +  RMSE
        lower_bound = log_estimate -  RMSE
        interval = 68

    return log_estimate, upper_bound, lower_bound , interval
Scaling Model Predictions to Today’s Market
When we train our model, it learns from the original Boston Housing dataset — a dataset collected in the 1970s where prices are measured in thousands of dollars. So even a “high price” in that data might be just $50,000.
But today, Boston home prices are much higher.
So if we just return the model’s predictions directly, we’d be showing values that are way too low for today’s market.
That’s where this scaling factor comes in:
Deep Dive: The get_log_estimate() Function
This function is the core logic behind our price prediction tool. It allows us to take just a couple of inputs — like how many rooms a house has and whether it’s next to the river — and return a predicted price range based on our trained regression model.
Let’s walk through the full structure of this function, with a focus on clarity and intent.
The goal is simple:
“Simulate a house with specific traits and ask the model: ‘How much would a house like this cost?’”
We only change the features we care about (like room count or river location), while keeping everything else at its average value — which reflects a typical Boston house. This is efficient, realistic, and makes the predictions easy to interpret.
1
2
3
4
5
6
7
8
9
10
11
12
13
14
15
16
17
18
19
20
21
22
23
24
25
26
27
28
29
30
31
32
33
34
35
36
37
38
39
40
###################################################################################

#  Estimate the price of a property in Boston

# Keywords Arguments:
# rooms_num -- Number of Rooms
# next_2_river -- True is property is next to river , False otherwise
# high_confidence -- True for a 95% Prediction Interval, False for a 68% Interval

###################################################################################

Num_of_rooms = 3
next_2_river = True
high_confidence = True

def get_actual_price():
    # Passing the get_log_estimate values
    result = get_log_estimate(Num_of_rooms, next_2_river=next_2_river, high_confidence=high_confidence)

    if result is None:
        return None

    estimated_price, ub, lb, intv = result

    # Converting to actual $ & scaling to today's prices
    actual_price = np.e ** estimated_price
    inflated_price = np.around((actual_price * sc) * 1000, -3)
    upper_range = np.around(np.e ** ub * 1000 * sc, -3)
    lower_range = np.around(np.e ** lb * 1000 * sc, -3)

    return inflated_price, upper_range, lower_range, intv

result = get_actual_price()

if result:
    price, ur, lr, intv = result
    print(f"Estimated price: ${price:,.0f}")
    print(f"Estimated price range: ${lr:,.0f} - ${ur:,.0f} with confidence of {intv}%")
else:
    print("Could not estimate price due to invalid input.")
1
2
Estimated price: $468,000
Estimated price range: $322,000 - $682,000 with confidence of 95%
Important Concept to Remember: How Are These Bounds Calculated?
One of the most valuable lessons from this function is understanding where the upper and lower bounds come from — and it all comes back to basic statistics.
The model gives us a mean estimate, but real-world predictions are never perfect.
That’s why we want to say something like:
“The actual price is probably somewhere around this value — give or take a bit.”
So how do we define that “give or take a bit”?
It’s Based on the Standard Deviation (RMSE here)
In statistics, standard deviation (SD) measures how spread out the values are from the mean.
For models, we use something similar called RMSE (Root Mean Squared Error) — which tells us how far off our predictions are, on average.
Here’s the logic:
- The model gives us a predicted value (the center, or “mean”).
- We then go above and below that value to create a range — using RMSE like a stand-in for standard deviation.
Full Code & Next Steps
If you’d like to explore the full code behind this project, you can find it in my GitHub repository (insert your repo link here).
Feel free to clone it, modify it, or use it as a starting point for your own experiments with regression modeling.
Thanks for reading! If you enjoyed this walkthrough or found it helpful, I’d love to connect:
Machine learning, like most things, is best learned by doing and sharing.
So keep experimenting, keep asking questions, and most importantly — keep building. Until next time, happy coding!