Tumor Severity Stratification Using Supervised Learning

In this project, we built a pipeline to classify tumor severity in lung adenocarcinoma patients using RNA-seq gene expression data from TCGA-LUAD (via cBioPortal). Patients with pathological stage > 1 were labeled as “severe,” and those with stage = 1 as “non-severe.”
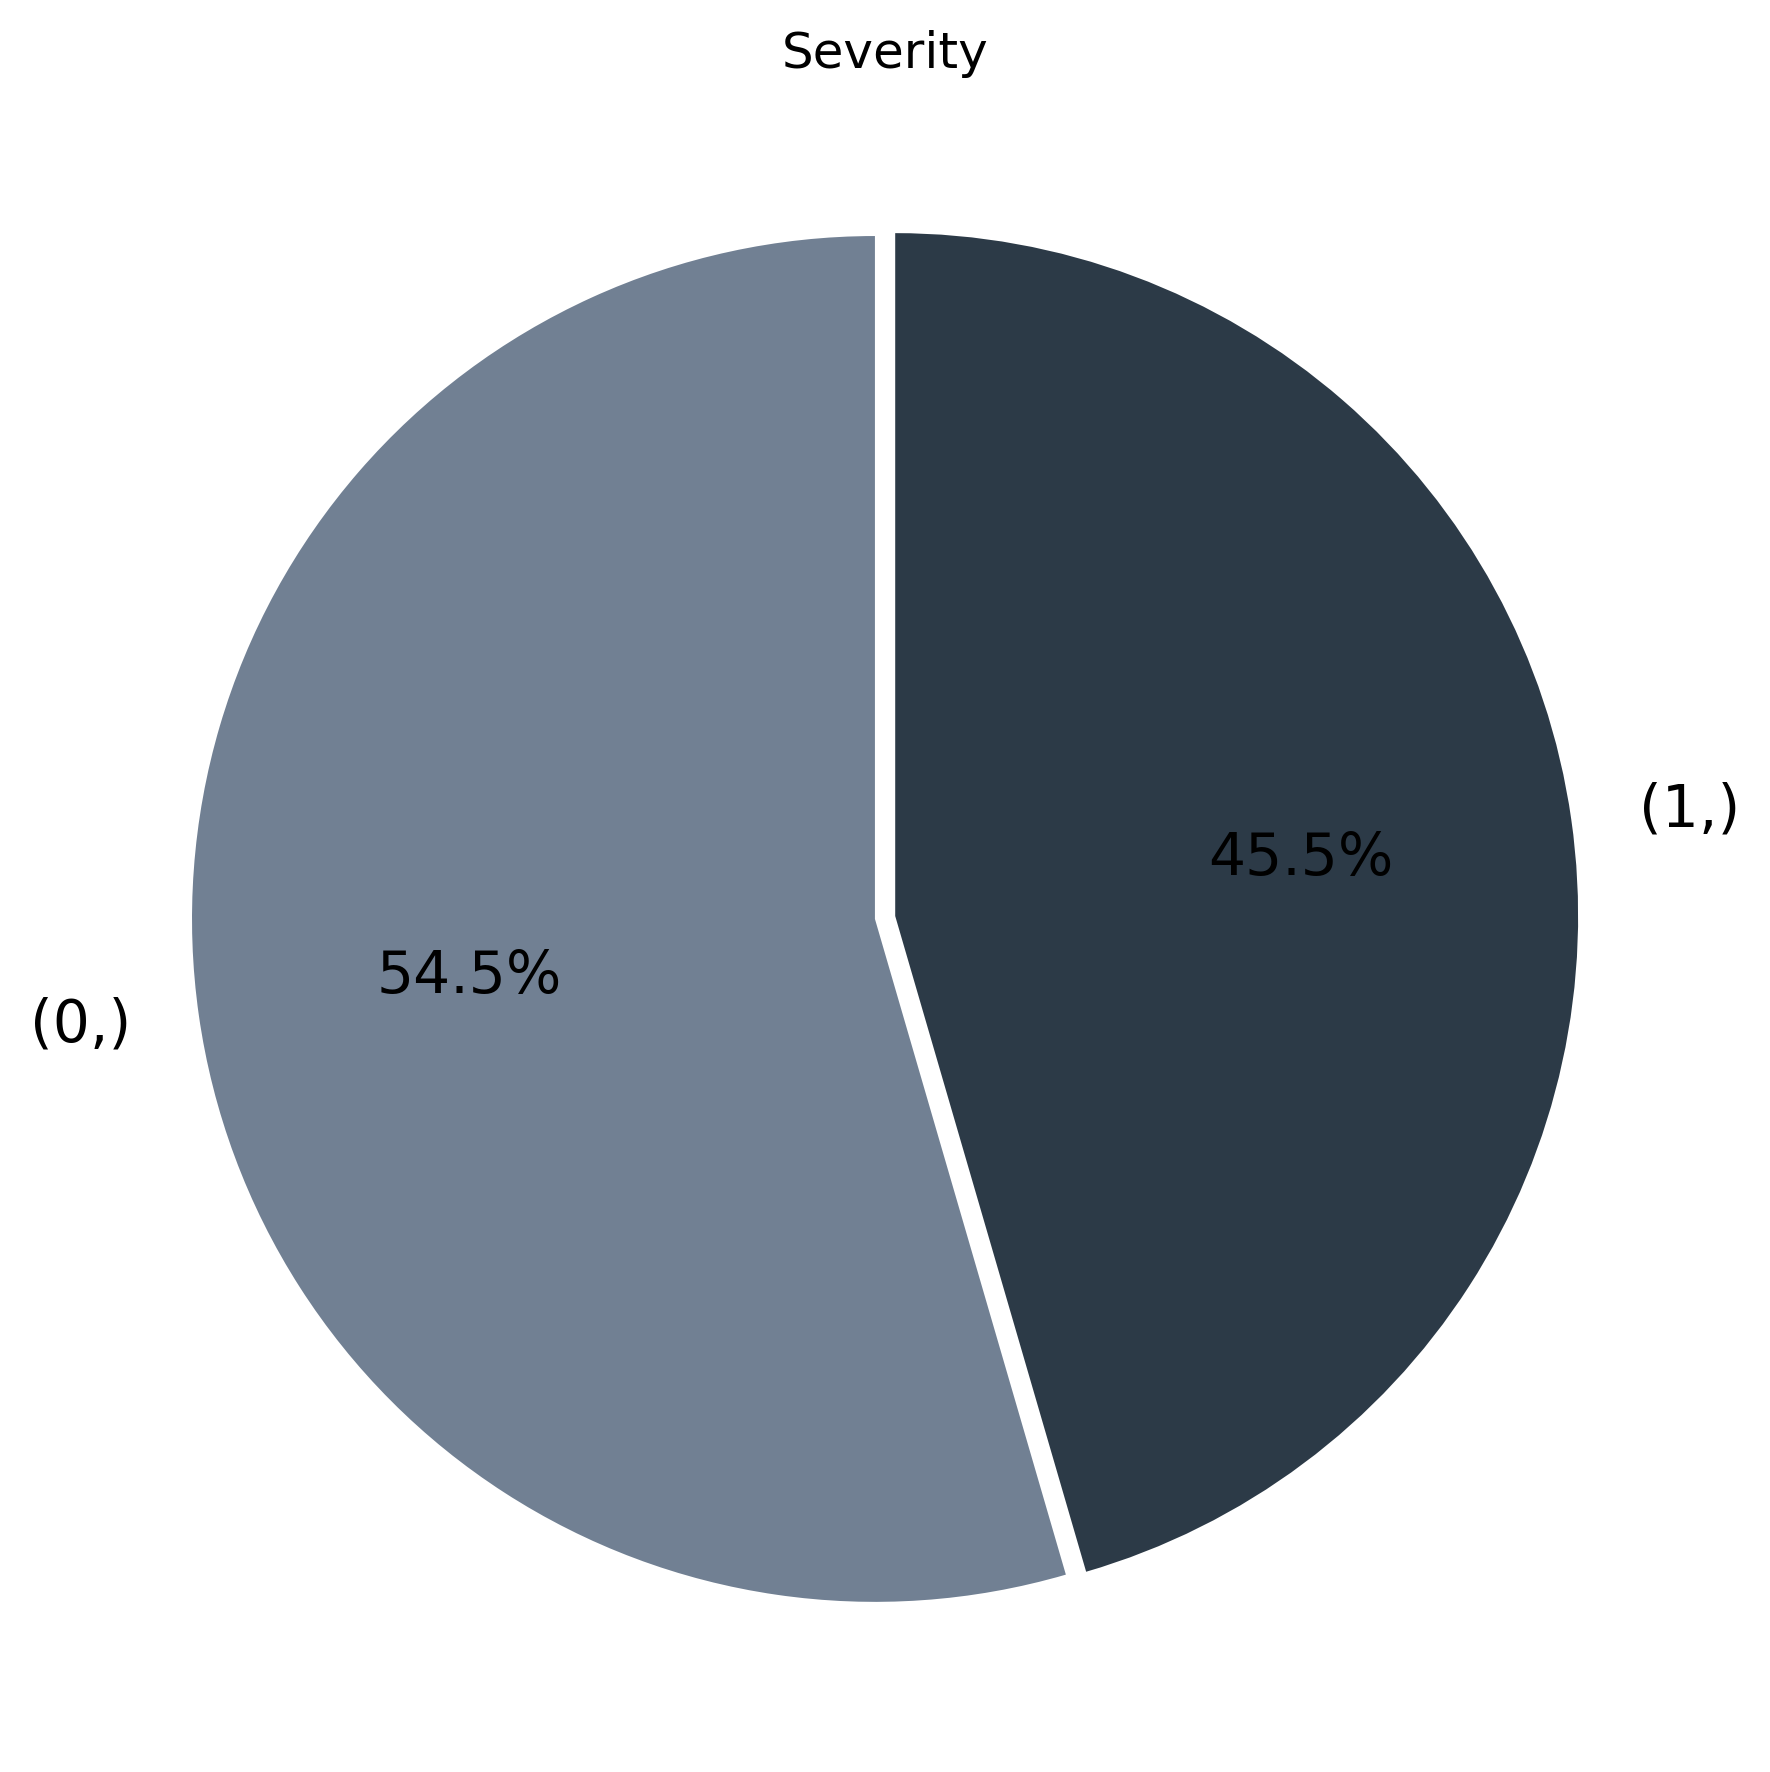
510 patients — 55% severe, 45% non-severe
ML models: Logistic Regression, SVM, Random Forest, CNN
Best accuracy: 79% (CNN with 25% DEGs)
Step-by-Step Workflow
1️Data Acquisition
We downloaded gene expression (TPM normalized) and clinical data from cBioPortal, focusing on the TCGA-LUAD cohort.
- Merged clinical labels with gene expression matrix
- Ensured 1 row per patient and gene symbols as columns
Label Engineering
We created binary labels based on pathological stage:
1
df_clinical["label"] = df_clinical["PATHOLOGICAL_STAGE"].apply(lambda x: 1 if "Stage I" in x else 0)
- 1 = Non-severe (Stage I)
- 0 = Severe (Stage II or higher)
Data Preprocessing
We aligned the labels with the expression matrix and handled missing values. Then we transposed the expression matrix:
1
2
3
df_expr = df_expr.T
df_expr.columns = df_expr.iloc[0]
df_expr = df_expr.drop(index=df_expr.index[0])
Feature Selection using ANOVA F-test
We applied the SelectKBest method to identify top features:
1
2
3
4
5
from sklearn.feature_selection import SelectKBest, f_classif

selector = SelectKBest(f_classif, k='all')
selector.fit(X, y)
f_scores = selector.scores_
We then selected the top 5%, 15%, and 25% of features based on F-scores.
Model Training and Evaluation
We trained and evaluated four models using cross-validation:
Logistic Regression
1
2
3
from sklearn.linear_model import LogisticRegression
model = LogisticRegression()
model.fit(X_train, y_train)
Support Vector Machine
1
2
3
from sklearn.svm import SVC
model = SVC(kernel='rbf', C=10)
model.fit(X_train, y_train)
Random Forest
1
2
3
from sklearn.ensemble import RandomForestClassifier
model = RandomForestClassifier(n_estimators=100, max_depth=15)
model.fit(X_train, y_train)
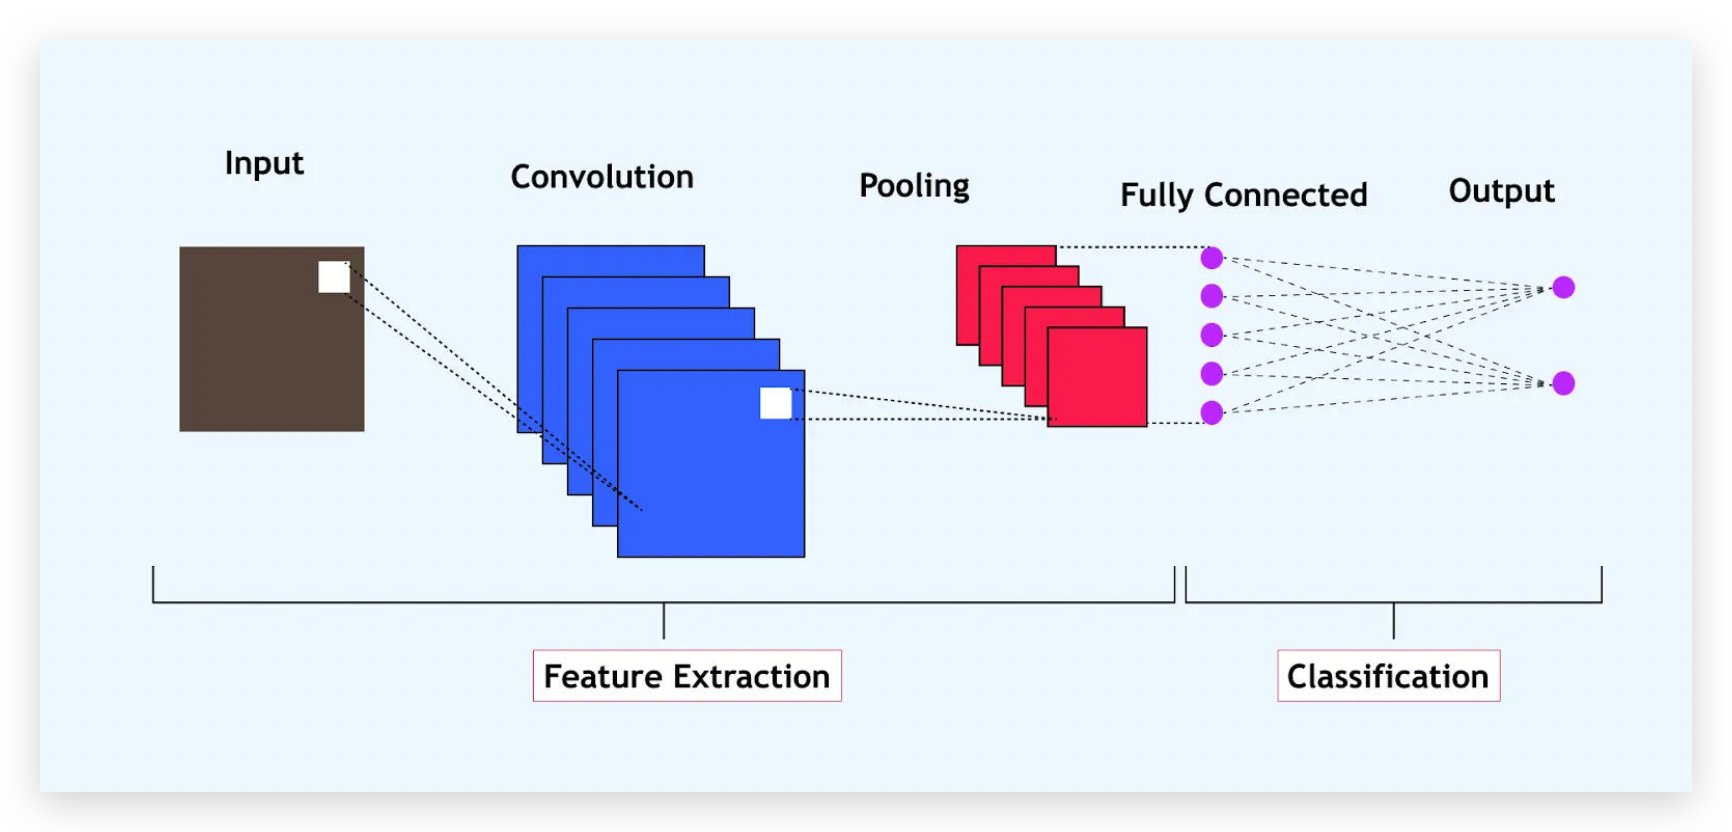
Convolutional Neural Network (Keras)
1
2
3
4
5
6
7
8
9
model = Sequential([
    Input(shape=(X.shape[1], 1)),
    Conv1D(64, kernel_size=2, activation='relu'),
    MaxPooling1D(pool_size=2),
    Flatten(),
    Dense(128, activation='relu'),
    Dropout(0.07),
    Dense(1, activation='sigmoid')
])
Results
| Feature Subset | Logistic | SVM | RF | CNN |
|---|---|---|---|---|
| 5% DEGs | 0.649 | 0.674 | 0.659 | 0.700 |
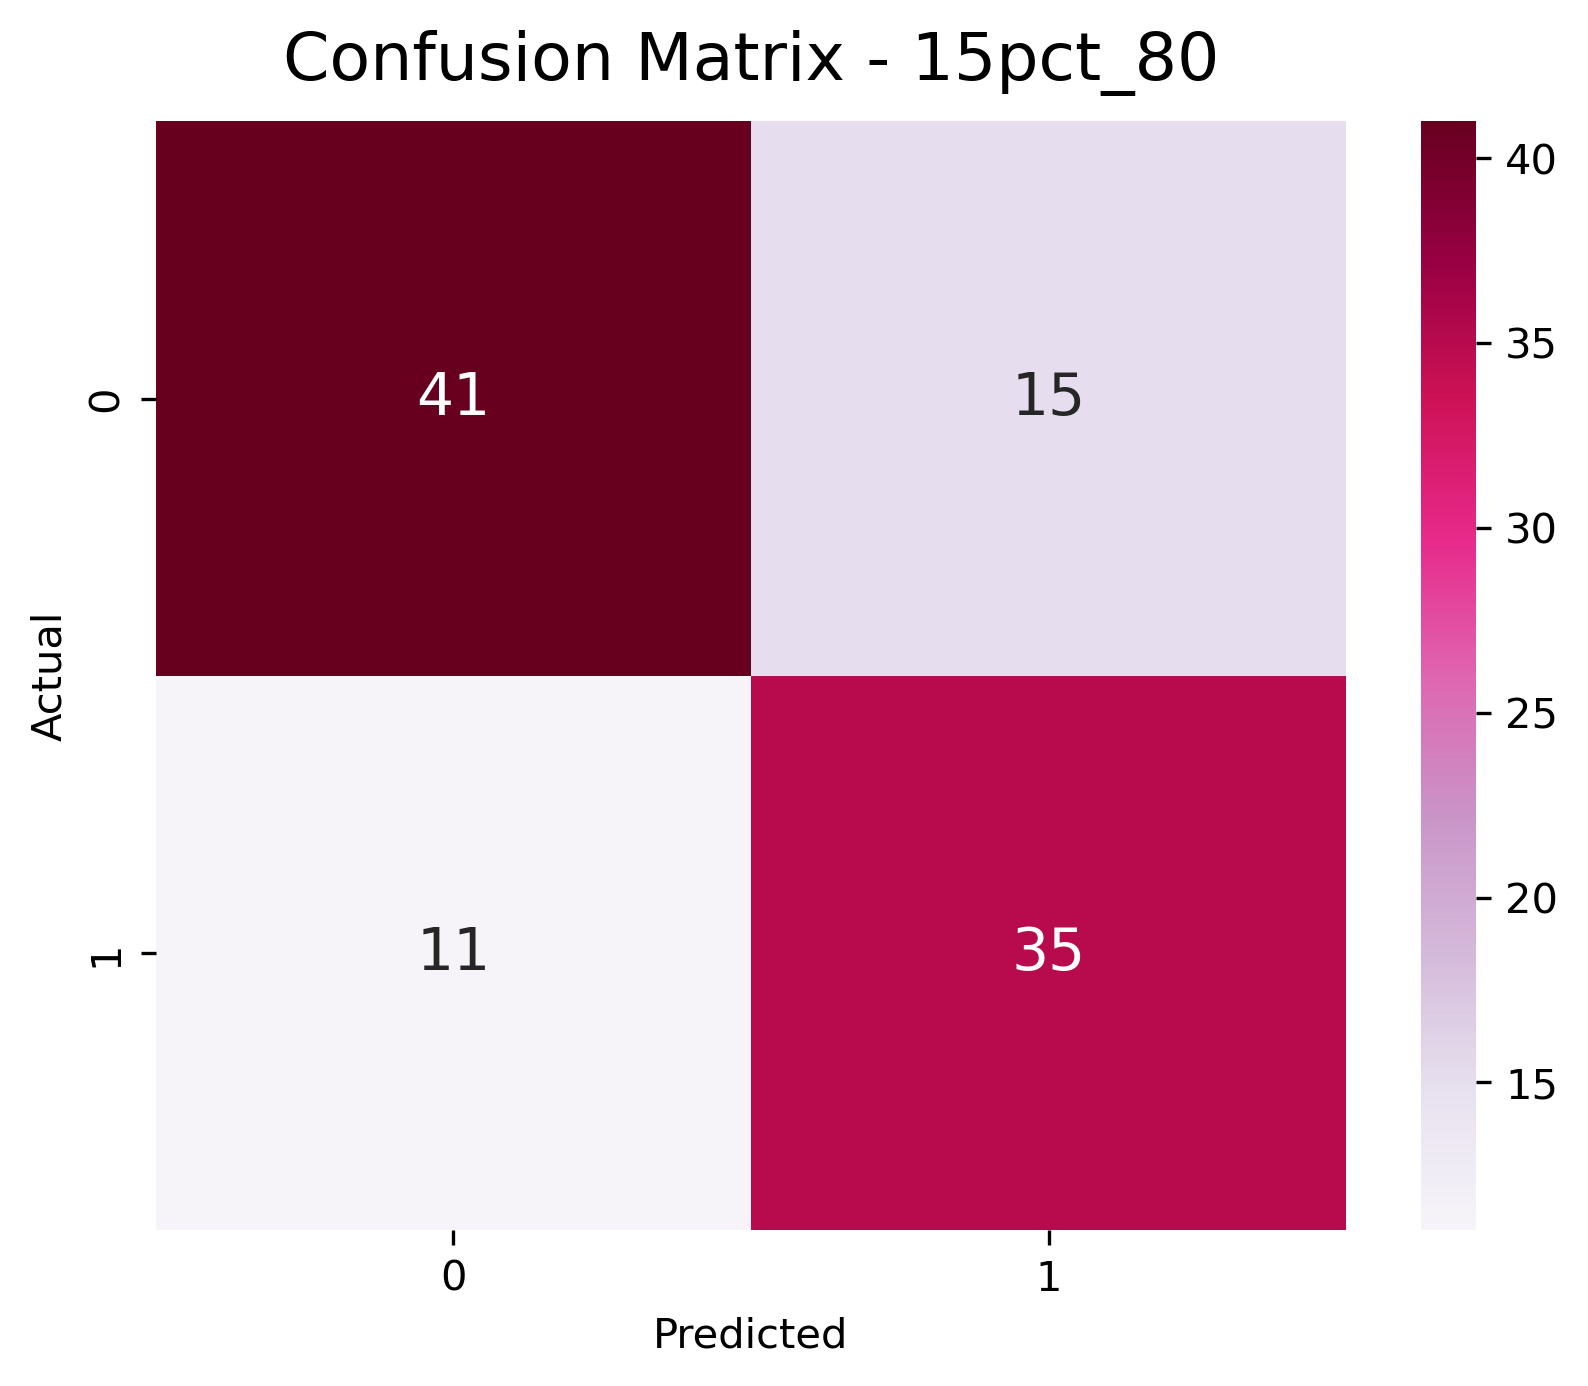
| 15% DEGs | 0.767 | 0.703 | 0.662 | 0.730 |
| 25% DEGs | 0.790 | 0.703 | 0.637 | 0.790 |
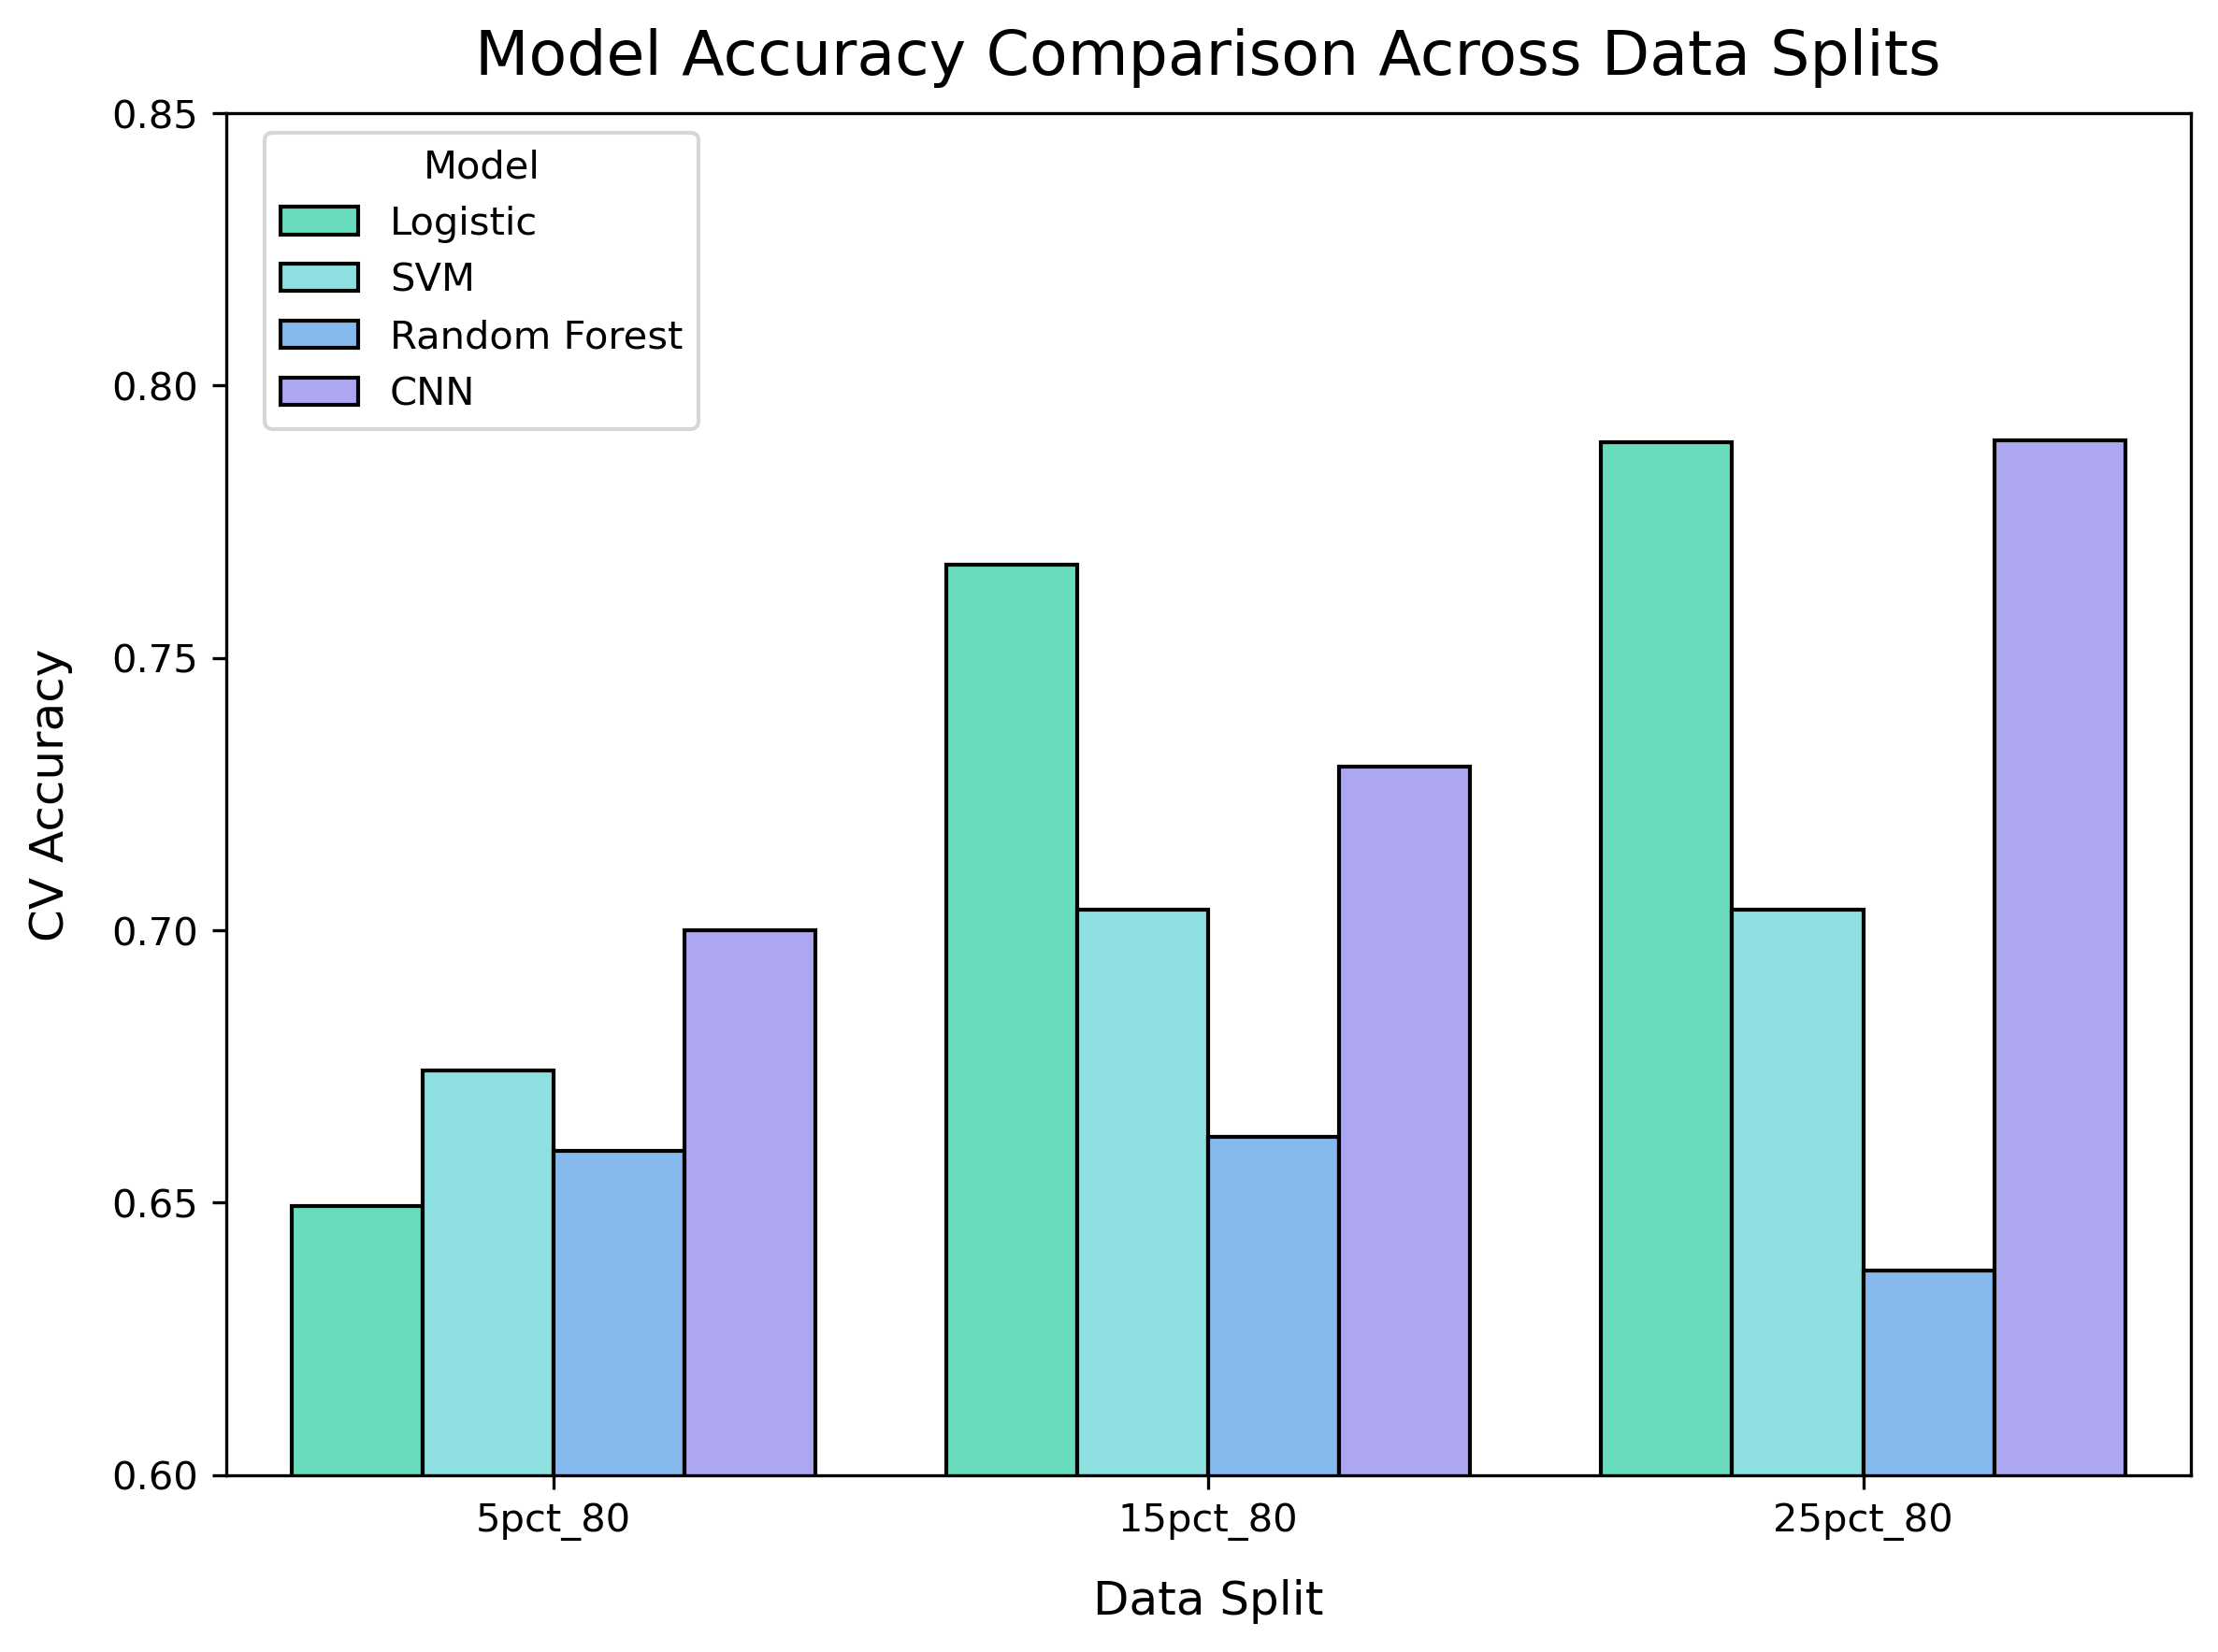
CNN achieved best performance with 25% selected features.{: .prompt-info}
Dockerized for Reproducibility
We created a Docker container to run this project anywhere:
1
2
3
4
5
6
FROM python:3.11-slim
WORKDIR /app
COPY requirements.txt .
RUN pip install --no-cache-dir -r requirements.txt
COPY . .
CMD ["jupyter", "notebook", "--ip=0.0.0.0", "--port=8888", "--allow-root", "--no-browser"]
Run with:
1
2
docker build -t tumor-severity-ml .
docker run -p 8888:8888 -v $(pwd):/app tumor-severity-ml
Future Directions
- Use DESeq2 for biologically informed feature selection
- Add SHAP for model interpretability
- Run the Nextflow pipeline on HPC to scale Optuna tuning
- Evaluate with confusion matrices and F1-score